
In trading data, it is common to see multiple purchases of the same cryptocurrency, often at different prices and quantities. If we want to compute the total quantity, total value, and weighted average price for each cryptocurrency, we need to organize and calculate the data. This article will guide you through achieving this using both Excel and Python.
Sample Data
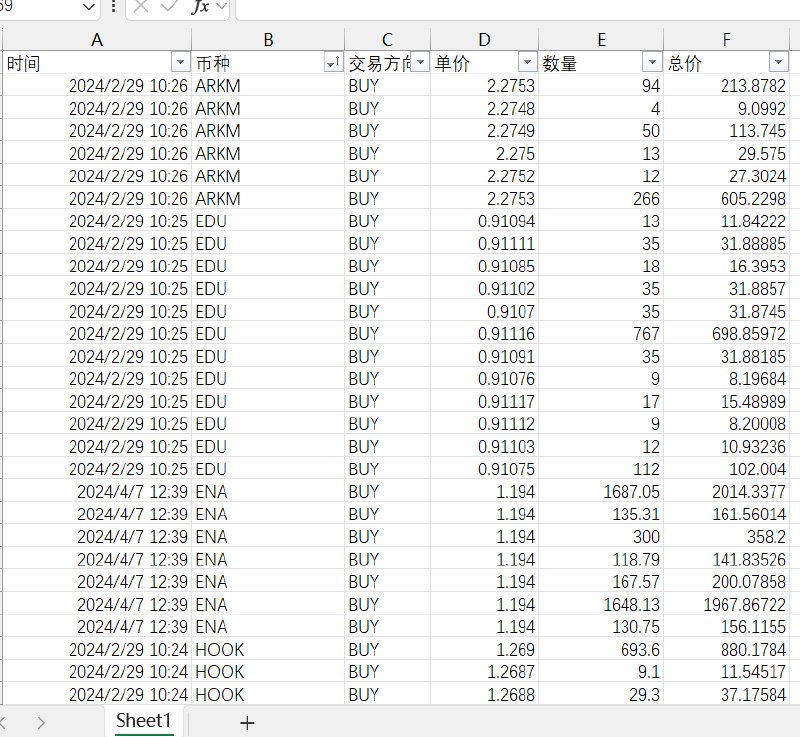
Assume we have a trading dataset with the following columns:
- Time: The transaction time
- Cryptocurrency: The purchased cryptocurrency
- Transaction Direction: Buy (BUY) or Sell (SELL)
- Price: The individual price of the cryptocurrency
- Quantity: The amount purchased
- Total Value: The total cost of the cryptocurrency (Price × Quantity)
For example:
| Time | Cryptocurrency | Transaction Direction | Price | Quantity | Total Value |
|---|---|---|---|---|---|
| 2024/2/29 10:26 | ARKM | BUY | 2.2753 | 94 | 213.8782 |
| 2024/2/29 10:26 | ARKM | BUY | 2.2748 | 4 | 9.0992 |
| 2024/2/29 10:26 | ARKM | BUY | 2.2749 | 50 | 113.745 |
| 2024/2/29 10:25 | EDU | BUY | 0.91094 | 13 | 11.8422 |
| 2024/4/7 12:39 | ENA | BUY | 1.194 | 1687.05 | 2014.3377 |
Alternatively, it might look like this:
 We need to calculate:
- The total quantity of each cryptocurrency.
- The total value of each cryptocurrency.
- The weighted average price for each cryptocurrency, calculated as
(Price * Quantity) / Total Quantity.
Method 1: Using Excel for Calculation
Excel’s pivot table feature is ideal for grouped statistics, though it lacks a built-in function for calculating weighted averages. Therefore, we need to adjust the process slightly:
Step 1: Create the Pivot Table
- Open the Excel file and ensure the data is formatted correctly.
- Select the entire data range (including headers), then click Insert -> Pivot Table.
- In the popup window, choose New Worksheet, then click OK.
Step 2: Set Up Pivot Table Fields
- Drag the Cryptocurrency field to the Rows area.
- Drag the Quantity and Total Value fields to the Values area, making sure they are set to sum (which is the default behavior).
This setup allows you to obtain the total quantity and total value for each cryptocurrency.
Step 3: Calculate Weighted Average Price
- Next to the pivot table, create a new column to calculate the weighted average price.
- Assuming the Total Value is in column G and Quantity is in column F, enter the following formula in the first cell of the new column (let’s say H2):
1=G2/F2 - Drag this formula down to fill the cells below, calculating the weighted average price for each cryptocurrency.
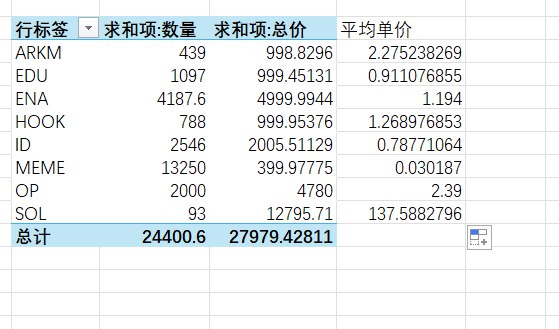
Complete Pivot Table Example
| Cryptocurrency | Total Quantity | Total Value | Weighted Average Price |
|---|---|---|---|
| ARKM | 529 | 1070.349 | 2.024 |
| EDU | 1004.3 | 915.561 | 0.912 |
| ENA | 5636.82 | 7639.734 | 1.353 |
The final table will look like this:
Method 2: Using Python to Calculate Weighted Average Price
If you prefer automating calculations with Python, you can utilize the pandas library for data processing. Below is a complete Python script to help you calculate the total quantity, total value, and weighted average price for each cryptocurrency.
Step 1: Install the pandas Library
If you haven’t installed the pandas library yet, you can install it using the following command:
|
|
Step 2: Python Script
|
|
Explanation:
- Read Data: Utilize
pandas’read_excel()function to load the Excel file. - Calculate Weighted Price: Use
Price * Quantityto compute the weighted price for each transaction. - Group by Cryptocurrency: Group the data by cryptocurrency to sum Total Quantity and Total Value (sum of weighted prices).
- Calculate Weighted Average Price: Finally, compute the weighted average price using
Total Value / Total Quantity. - Output Results: Save the results into a new Excel file using
to_excel().
Output Result
| Cryptocurrency | Total Quantity | Total Value | Average Price |
|---|---|---|---|
| ARKM | 529 | 1070.349 | 2.024 |
| EDU | 1004.3 | 915.561 | 0.912 |
| ENA | 5636.82 | 7639.734 | 1.353 |
Summary
- Excel Method: You can quickly achieve cryptocurrency statistics through the pivot table and manual calculation of the weighted average price.
- Python Method: Using
pandasallows for automated processing, making it particularly useful for larger datasets.
Choose the method that best fits your needs, and feel free to reach out if you have any questions or require further adjustments!